docker exec -ti
kill -3 1
Explaination
We generally believe "kill" command is used to kill a process. But "kill" is just a way to send a signal to running process. Each process interprets these signals in their own way. However, generally,
kill -9
is used to forcibly terminate a running process.JVM interprets "-3" as a signal to print thread dump in STDOUT (console output). And this is exactly what we wish to use.
Running java app as docker container
You could refer to my post Java app on Docker to see how we can run a java application inside docker container.
Find running container
So first we need to exec into running container. And to do that we first need to find a running container.docker ps
Now we know that container id is c09603af9690.
Tail logs
Thread dump is dumped by JVM in logs. So let us tail logs first.
docker logs -f c09603af9690
Exec into container
Now we need to exec into running container. This depends on base image that is being used. I am using alpine. So I have shell available at /bin/sh of docker container.docker exec -ti c09603af9690 /bin/sh
Now we need process id of java process. Usually if docker container was created using java process, then it has a process id of 1. Still it is better to confirm.
docker ps
And then issue our main command
kill -3 1
Check logs
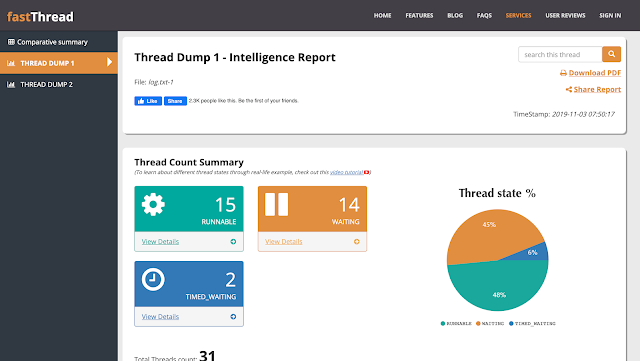
Note: I copied logs above from console and dumped into a log.txt file. One of my favourite tools for thread dump analysis is https://fastthread.io/. Thread dump analysis looks like
This is just a small portion of page. fastthread.io displays information in an easy to understand way.


Good to see this post!
ReplyDeleteOne small correction though:
"JVM interprets "-3" as a signal to print thread dump in its logs" ==> JVM prints the thread-dump in STDOUT (Console, in most cases), but not to log files!
In our infrastructure, console outputs has been routed to Kibana / ELK.
Thank you for correcting me. I have updated post.
Delete